 When you click on links to various merchants on this site and make a purchase, this can result in this site earning a commission. Affiliate programs and affiliations include, but are not limited to, the eBay Partner Network. When you click on links to various merchants on this site and make a purchase, this can result in this site earning a commission. Affiliate programs and affiliations include, but are not limited to, the eBay Partner Network.
You may install the software on up to two (2) computers.License is good for 6 months. If needed you can order another copywhen yours has expired. Runs on Windows and Mac OS.Shipping: ships out next business day after you place your order
Why buy from us? - Available for immediate download. Just message us after you place your order.
- Buy with confidence from a company with 18 years of experience, and 12 years as a trusted seller on . See our "Me" profile for more information.
- You can always call us with any questions. Don't buy from a seller who won't take your calls. Just message us for our toll free number.
- We are Top Rated Plus thanks to great customer service.
- Don't get burned by counterfeiters who claim they are selling legitimate products.
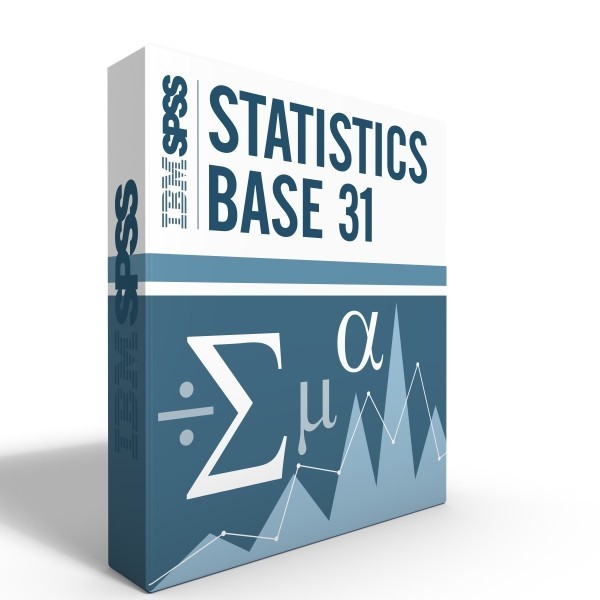
Includes: - IBM SPSS Base 31 6 month license
- No limitation on the number of variables or cases
- Be sure you have all the ad-ons needed for your course or dissertation! Consider the GradPack Premium or GradPack Standard.
IBM SPSS Base Overview, Features and Benefits IBM® SPSS® Statistics Base is easy to use and forms the foundation for many types of statistical analyses. The procedureswithin IBM SPSS Statistics Base will enable you to get a quick look atyour data, formulate hypotheses for additional testing, and then carryout a number of statistical and analytic procedures to help clarifyrelationships between variables, create clusters, identify trends andmake predictions. - Quickly access and analyze massive datasets
- Easily prepare and manage your data for analysis
- Analyze data with a comprehensive range of statistical procedures
- Easily build charts with sophisticated reporting capabilities
- Discover new insights in your data with tables, graphs, cubes and pivoting technology
- Quickly build dialog boxes or let advanced users createcustomized dialog boxes that make your organization’s analyses easierand more efficient
Descriptive Statistics
- Crosstabulations - Counts, percentages, residuals,marginals, tests of independence, test of linear association, measure oflinear association, ordinal data measures, nominal by intervalmeasures, measure of agreement, relative risk estimates for case controland cohort studies.
- Frequencies - Counts, percentages, valid and cumulative percentages; central tendency, dispersion, distribution and percentile values.
- Descriptives - Central tendency, dispersion, distribution and Z scores.
- Descriptive ratio statistics - Coefficient of dispersion, coefficient of variation, price-related differential and average absolute deviance.
- Compare means - Choose whether to use harmonic orgeometric means; test linearity; compare via independent samplestatistics, paired sample statistics or one-sample t test.
- ANOVA and ANCOVA - Conduct contrast, range and posthoc tests; analyze fixed-effects and random-effects measures; groupdescriptive statistics; choose your model based on four types of thesum-of-squares procedure; perform lack-of-fit tests; choose balanced orunbalanced design; and analyze covariance with up to 10 methods.
- Correlation - Test for bivariate or partial correlation, or for distances indicating similarity or dissimilarity between measures.
- Nonparametric tests - Chi-square, Binomial, Runs,one-sample, two independent samples, k-independent samples, two relatedsamples, k-related samples.
- Explore - Confidence intervals for means; M-estimators; identification of outliers; plotting of findings.
Tests to Predict Numerical Outcomes and Identify Groups:IBM SPSS StatisticsBase contains procedures for the projects you are working on now and anynew ones to come. You can be confident that you’ll always have theanalytic tools you need to get the job done quickly and effectively. - Factor Analysis - Used to identify the underlyingvariables, or factors, that explain the pattern of correlations within aset of observed variables. In IBM SPSS Statistics Base, the factoranalysis procedure provides a high degree of flexibility, offering:
- Seven methods of factor extraction
- Five methods of rotation, including direct oblimin and promax for nonorthogonal rotations
- Three methods of computing factor scores. Also, scores can be saved as variables for further analysis
- K-means Cluster Analysis - Used to identifyrelatively homogeneous groups of cases based on selectedcharacteristics, using an algorithm that can handle large numbers ofcases but which requires you to specify the number of clusters. Selectone of two methods for classifying cases, either updating clustercenters iteratively or classifying only.
- Hierarchical Cluster Analysis - Used to identifyrelatively homogeneous groups of cases (or variables) based on selectedcharacteristics, using an algorithm that starts with each case in aseparate cluster and combines clusters until only one is left. Analyzeraw variables or choose from a variety of standardizing transformations.Distance or similarity measures are generated by the Proximitiesprocedure. Statistics are displayed at each stage to help you select thebest solution.
- TwoStep Cluster Analysis - Group observations intoclusters based on nearness criterion, with either categorical orcontinuous level data; specify the number of clusters or let the numberbe chosen automatically.
- Discriminant - Offers a choice of variable selectionmethods, statistics at each step and in a final summary; output isdisplayed at each step and/or in final form.
- Linear Regression - Choose from six methods:backwards elimination, forced entry, forced removal, forward entry,forward stepwise selection and R2 change/test of significance; producesnumerous descriptive and equation statistics.
- Ordinal regression—PLUM - Choose from seven optionsto control the iterative algorithm used for estimation, to specifynumerical tolerance for checking singularity, and to customize output;five link functions can be used to specify the model.
- Nearest Neighbor analysis - Use for prediction (witha specified outcome) or for classification (with no outcome specified);specify the distance metric used to measure the similarity of cases;and control whether missing values or categorical variables are treatedas valid values.
What's New in IBM SPSS Base - Faster Processing - runs faster than ever
- Automatic Linear Models – A new family of algorithmsmakes it possible for business analysts and analytic professionals tobuild powerful linear models in an easy and automated manner.
- Syntax Editor – More than a dozen performance andease-of-use enhancements for writing syntax in the syntax editor basedon customer response, including tooltip tip displaying the “name,”improved scrolling, improved indentation of lines, toggle commenting“on” or “off”, the ability to split the syntax editor window, and manymore.
- Default Measurement Level – When a data file isopened, a measurement level is automatically assigned so businessanalysts can focus on solving their business problem rather thanmanually setting the measurement level.
- Faster Performance – Save time when creating reportsthat involve large tables or a large number of smaller tables. Creatingpivot tables in the output is now up to 200% times faster than before.In addition, tables will also take up less memory
With IBM SPSS Statistics Baseyou can be confident in your analytic results. This comprehensivesoftware solution includes a wide range of procedures and tests to solveyour business and research challenges. System Requirements:
License Term:6 months
Windows: Operating system: Microsoft Windows 8 or higher Hardware:
Intel® or AMD x86 processor running at 1GHz or higher
Memory: 1GB RAM or more recommended
Minimum free drive space: 800MB***
Mac: Operating system: * Apple® Mac 10.13 or higher Hardware: - Intel processor (32 and 64 bit)
- Memory: 1GB RAM or more recommended
- Minimum free drive space: 800MB***
 |
|